一、Pandas读取数据
import pandas as pd
df = pd.read_csv('./data/titanic.csv')
df.head(6) #.head()可以读取前几条数据,指定前几条都可以,相对应还有.tail()df.info()返回当前的信息:
<class 'pandas.core.frame.DataFrame'>
RangeIndex: 891 entries, 0 to 890
Data columns (total 12 columns):
PassengerId    891 non-null int64
Survived       891 non-null int64
Pclass         891 non-null int64
Name           891 non-null object
Sex            891 non-null object
Age            714 non-null float64
SibSp          891 non-null int64
Parch          891 non-null int64
Ticket         891 non-null object
Fare           891 non-null float64
Cabin          204 non-null object
Embarked       889 non-null object
dtypes: float64(2), int64(5), object(5)
memory usage: 83.6+ KBdf.index:返回RangeIndex(start=0, stop=891, step=1)df.columns:返回
Index(['PassengerId', 'Survived', 'Pclass', 'Name', 'Sex', 'Age', 'SibSp',
       'Parch', 'Ticket', 'Fare', 'Cabin', 'Embarked'],
dtype='object')df.dtypes:返回
PassengerId      int64
Survived         int64
Pclass           int64
Name            object
Sex             object
Age            float64
SibSp            int64
Parch            int64
Ticket          object
Fare           float64
Cabin           object
Embarked        object
dtype: objectdf.values:返回
array([[1, 0, 3, ..., 7.25, nan, 'S'],
       [2, 1, 1, ..., 71.2833, 'C85', 'C'],
       [3, 1, 3, ..., 7.925, nan, 'S'],
       ...,
       [889, 0, 3, ..., 23.45, nan, 'S'],
       [890, 1, 1, ..., 30.0, 'C148', 'C'],
       [891, 0, 3, ..., 7.75, nan, 'Q']], dtype=object)
二、Pandas基本操作
2.1 基本结构及操作
创建一个DataFrame结构:
data = {'country':['aaa','bbb','ccc'],
       'population':[10,12,14]}
df_data = pd.DataFrame(data)df_data则为:
| country | population | |
|---|---|---|
| 0 | aaa | 10 |
| 1 | bbb | 12 |
| 2 | ccc | 14 |
series是DataFrame中的一行/列,底层是ndarray结构。取指定的数据:
age = df['Age']
age[:5]
打印结果为:
0    22.0
1    38.0
2    26.0
3    35.0
4    35.0
Name: Age, dtype: float64pandas中索引可以由我们自己指定:
df = df.set_index('Name')
df.head()| Name | PassengerId | Survived | Pclass | Sex | Age | SibSp | Parch | Ticket | Fare | Cabin | Embarked |
|---|---|---|---|---|---|---|---|---|---|---|---|
| Braund, Mr. Owen Harris | 1 | 0 | 3 | male | 22.0 | 1 | 0 | A/5 21171 | 7.2500 | NaN | S |
| Cumings, Mrs. John Bradley (Florence Briggs Thayer) | 2 | 1 | 1 | female | 38.0 | 1 | 0 | PC 17599 | 71.2833 | C85 | C |
| Heikkinen, Miss. Laina | 3 | 1 | 3 | female | 26.0 | 0 | 0 | STON/O2. 3101282 | 7.9250 | NaN | S |
| Futrelle, Mrs. Jacques Heath (Lily May Peel) | 4 | 1 | 1 | female | 35.0 | 1 | 0 | 113803 | 53.1000 | C123 | S |
| Allen, Mr. William Henry | 5 | 0 | 3 | male | 35.0 | 0 | 0 | 373450 | 8.0500 | NaN | S |
然后打印df['Age'][:5],则结果为:
Name
Braund, Mr. Owen Harris                                22.0
Cumings, Mrs. John Bradley (Florence Briggs Thayer)    38.0
Heikkinen, Miss. Laina                                 26.0
Futrelle, Mrs. Jacques Heath (Lily May Peel)           35.0
Allen, Mr. William Henry                               35.0
Name: Age, dtype: float64打印age['Allen, Mr. William Henry'],则结果为35.0。
pandas可以对结果进行运算:
age = age + 10
age[:5]
打印结果为:
Name
Braund, Mr. Owen Harris                                32.0
Cumings, Mrs. John Bradley (Florence Briggs Thayer)    48.0
Heikkinen, Miss. Laina                                 36.0
Futrelle, Mrs. Jacques Heath (Lily May Peel)           45.0
Allen, Mr. William Henry                               45.0
Name: Age, dtype: float64
age = age *10同理,与numpy的语法一致。
age.mean()		#396.99117647058824,均值
age.max()		#900.0
age.min() #104.2describe()函数可以得到数据的基本统计特性,即数量、均值、标准差、最小值、25/50/75%值、最大值:
| PassengerId | Survived | Pclass | Age | SibSp | Parch | Fare | |
|---|---|---|---|---|---|---|---|
| count | 891.000000 | 891.000000 | 891.000000 | 714.000000 | 891.000000 | 891.000000 | 891.000000 |
| mean | 446.000000 | 0.383838 | 2.308642 | 29.699118 | 0.523008 | 0.381594 | 32.204208 |
| std | 257.353842 | 0.486592 | 0.836071 | 14.526497 | 1.102743 | 0.806057 | 49.693429 |
| min | 1.000000 | 0.000000 | 1.000000 | 0.420000 | 0.000000 | 0.000000 | 0.000000 |
| 25% | 223.500000 | 0.000000 | 2.000000 | 20.125000 | 0.000000 | 0.000000 | 7.910400 |
| 50% | 446.000000 | 0.000000 | 3.000000 | 28.000000 | 0.000000 | 0.000000 | 14.454200 |
| 75% | 668.500000 | 1.000000 | 3.000000 | 38.000000 | 1.000000 | 0.000000 | 31.000000 |
| max | 891.000000 | 1.000000 | 3.000000 | 80.000000 | 8.000000 | 6.000000 | 512.329200 |
2.2 pandas索引
上一节介绍的索引定位:
df[['Age','Fare']][:5]打印结果为:
| Age | Fare | |
|---|---|---|
| 0 | 22.0 | 7.2500 |
| 1 | 38.0 | 71.2833 |
| 2 | 26.0 | 7.9250 |
| 3 | 35.0 | 53.1000 |
| 4 | 35.0 | 8.0500 |
2.2.1 iloc
iloc:用position来去定位。
df.iloc[0]的打印结果为:
PassengerId                          1
Survived                             0
Pclass                               3
Name           Braund, Mr. Owen Harris
Sex                               male
Age                                 22
SibSp                                1
Parch                                0
Ticket                       A/5 21171
Fare                              7.25
Cabin                              NaN
Embarked                             S
Name: 0, dtype: object同理,df.iloc[0:5]的打印结果为:
| PassengerId | Survived | Pclass | Name | Sex | Age | SibSp | Parch | Ticket | Fare | Cabin | Embarked | |
|---|---|---|---|---|---|---|---|---|---|---|---|---|
| 0 | 1 | 0 | 3 | Braund, Mr. Owen Harris | male | 22.0 | 1 | 0 | A/5 21171 | 7.2500 | NaN | S |
| 1 | 2 | 1 | 1 | Cumings, Mrs. John Bradley (Florence Briggs Th… | female | 38.0 | 1 | 0 | PC 17599 | 71.2833 | C85 | C |
| 2 | 3 | 1 | 3 | Heikkinen, Miss. Laina | female | 26.0 | 0 | 0 | STON/O2. 3101282 | 7.9250 | NaN | S |
| 3 | 4 | 1 | 1 | Futrelle, Mrs. Jacques Heath (Lily May Peel) | female | 35.0 | 1 | 0 | 113803 | 53.1000 | C123 | S |
| 4 | 5 | 0 | 3 | Allen, Mr. William Henry | male | 35.0 | 0 | 0 | 373450 | 8.0500 | NaN | S |
df.iloc[0:5,1:3]的打印结果为:
| Survived | Pclass | |
|---|---|---|
| 0 | 0 | 3 |
| 1 | 1 | 1 |
| 2 | 1 | 3 |
| 3 | 1 | 1 |
| 4 | 0 | 3 |
2.2.2 loc
loc:用label来去定位。
df = df.set_index('Name')
df.loc['Heikkinen, Miss. Laina']
打印结果为:
PassengerId                   3
Survived                      1
Pclass                        3
Sex                      female
Age                          26
SibSp                         0
Parch                         0
Ticket         STON/O2. 3101282
Fare                      7.925
Cabin                       NaN
Embarked                      S
Name: Heikkinen, Miss. Laina, dtype: object
打印某个指标:
df.loc['Heikkinen, Miss. Laina','Fare'] #7.9249999999999998可以使用切片进行索引:
df.loc['Heikkinen, Miss. Laina':'Allen, Mr. William Henry',:]打印结果为:
| Name | PassengerId | Survived | Pclass | Sex | Age | SibSp | Parch | Ticket | Fare | Cabin | Embarked |
|---|---|---|---|---|---|---|---|---|---|---|---|
| Heikkinen, Miss. Laina | 3 | 1 | 3 | female | 26.0 | 0 | 0 | STON/O2. 3101282 | 7.925 | NaN | S |
| Futrelle, Mrs. Jacques Heath (Lily May Peel) | 4 | 1 | 1 | female | 35.0 | 1 | 0 | 113803 | 53.100 | C123 | S |
| Allen, Mr. William Henry | 5 | 0 | 3 | male | 35.0 | 0 | 0 | 373450 | 8.050 | NaN | S |
可以进行赋值操作:
df.loc['Heikkinen, Miss. Laina','Fare'] = 1000
df.head()
2.2.3 bool类型的索引
df['Fare'] > 40返回结果为:
Name
Braund, Mr. Owen Harris                                      False
Cumings, Mrs. John Bradley (Florence Briggs Thayer)           True
Heikkinen, Miss. Laina                                        True
Futrelle, Mrs. Jacques Heath (Lily May Peel)                  True
Allen, Mr. William Henry                                     False
Moran, Mr. James                                             False
McCarthy, Mr. Timothy J                                       True
......df[df['Fare'] > 40][:5]返回结果为:
| Name | PassengerId | Survived | Pclass | Sex | Age | SibSp | Parch | Ticket | Fare | Cabin | Embarked |
|---|---|---|---|---|---|---|---|---|---|---|---|
| Cumings, Mrs. John Bradley (Florence Briggs Thayer) | 2 | 1 | 1 | female | 38.0 | 1 | 0 | PC 17599 | 71.2833 | C85 | C |
| Heikkinen, Miss. Laina | 3 | 1 | 3 | female | 26.0 | 0 | 0 | STON/O2. 3101282 | 1000.0000 | NaN | S |
| Futrelle, Mrs. Jacques Heath (Lily May Peel) | 4 | 1 | 1 | female | 35.0 | 1 | 0 | 113803 | 53.1000 | C123 | S |
| McCarthy, Mr. Timothy J | 7 | 0 | 1 | male | 54.0 | 0 | 0 | 17463 | 51.8625 | E46 | S |
| Fortune, Mr. Charles Alexander | 28 | 0 | 1 | male | 19.0 | 3 | 2 | 19950 | 263.0000 | C23 C25 C27 | S |
df[df['Sex'] == 'male'][:5],返回的结果类似。
可以对这些数据进行运算:
比如对
Age作平均值:df.loc[df['Sex'] == 'male','Age'].mean()计数:
(df['Age'] > 70).sum()
2.2.4 索引进阶isin/where/query
s = pd.Series(np.arange(5),index = np.arange(5)[::-1],dtype='int64')判断一个数是否在当前序列中:
s.isin([1,3,4])4 False
3 True
2 False
1 True
0 True
dtype: bools2 = pd.Series(np.arange(6),index = pd.MultiIndex.from_product([[0,1],['a','b','c']]))0 a 0
b 1
c 2
1 a 3
b 4
c 5
dtype: int32s2.iloc[s2.index.isin([(1,'a'),(0,'b')])]0 b 1
1 a 3dates = pd.date_range('20220819',periods=8)
df = pd.DataFrame(np.random.randn(8,4),index=dates,columns=['A','B','C','D'])| A | B | C | D | |
|---|---|---|---|---|
| 2022-08-19 | -1.400125 | 1.250936 | -0.220523 | 0.771322 |
| 2022-08-20 | -0.837570 | -0.321949 | 1.868991 | -1.722395 |
| 2022-08-21 | -0.578139 | 0.431476 | -0.019026 | -0.040017 |
| 2022-08-22 | 0.385588 | 2.463628 | -0.066183 | -0.948124 |
| 2022-08-23 | 0.833327 | 0.451540 | -1.124371 | -0.328375 |
| 2022-08-24 | -0.387599 | 1.547158 | -0.806947 | 0.233735 |
| 2022-08-25 | -0.940428 | 0.286457 | 0.412619 | 0.531194 |
| 2022-08-26 | -0.379863 | -0.211559 | -1.288098 | 1.592291 |
df.where(df < 0)| A | B | C | D | |
|---|---|---|---|---|
| 2022-08-19 | -1.400125 | NaN | -0.220523 | NaN |
| 2022-08-20 | -0.837570 | -0.321949 | NaN | -1.722395 |
| 2022-08-21 | -0.578139 | NaN | -0.019026 | -0.040017 |
| 2022-08-22 | NaN | NaN | -0.066183 | -0.948124 |
| 2022-08-23 | NaN | NaN | -1.124371 | -0.328375 |
| 2022-08-24 | -0.387599 | NaN | -0.806947 | NaN |
| 2022-08-25 | -0.940428 | NaN | NaN | NaN |
| 2022-08-26 | -0.379863 | -0.211559 | -1.288098 | NaN |
df.where(df < 0,-df) #不满足条件的可以指定取反| A | B | C | D | |
|---|---|---|---|---|
| 2017-11-24 | -1.690231 | -0.338101 | -1.071022 | -1.084637 |
| 2017-11-25 | -1.292291 | -0.449885 | -0.468264 | -0.637102 |
| 2017-11-26 | -0.602494 | -0.591658 | -0.301893 | -1.050524 |
| 2017-11-27 | -1.132170 | -1.310110 | -0.552812 | -0.370947 |
| 2017-11-28 | -0.113234 | -0.859983 | -0.381977 | -0.371730 |
| 2017-11-29 | -0.616029 | -0.209225 | -1.879964 | -0.179152 |
| 2017-11-30 | -0.554969 | -0.656240 | -2.449274 | -0.302113 |
| 2017-12-01 | -0.700342 | -1.068990 | -0.572698 | -0.577581 |
df = pd.DataFrame(np.random.rand(10,3),columns = list('abc'))| a | b | c | |
|---|---|---|---|
| 0 | 0.760971 | 0.910097 | 0.480540 |
| 1 | 0.242792 | 0.778342 | 0.852441 |
| 2 | 0.147953 | 0.449719 | 0.539780 |
| 3 | 0.519164 | 0.936192 | 0.402399 |
| 4 | 0.365343 | 0.148621 | 0.176917 |
| 5 | 0.837852 | 0.283028 | 0.527734 |
| 6 | 0.729312 | 0.066871 | 0.747968 |
| 7 | 0.502851 | 0.462246 | 0.116735 |
| 8 | 0.472404 | 0.517753 | 0.945877 |
| 9 | 0.962282 | 0.300276 | 0.258252 |
查询操作:
df.query('(a<b)')
df.query('(a<b) & (b<c)')
2.3 groupby操作
df = pd.DataFrame({'key':['A','B','C','A','B','C','A','B','C'],
'data':[0,5,10,5,10,15,10,15,20]})| data | key | |
|---|---|---|
| 0 | 0 | A |
| 1 | 5 | B |
| 2 | 10 | C |
| 3 | 5 | A |
| 4 | 10 | B |
| 5 | 15 | C |
| 6 | 10 | A |
| 7 | 15 | B |
| 8 | 20 | C |
for key in ['A','B','C']:
    print (key,df[df['key'] == key].sum())
打印结果为:
A data     15
key     AAA
dtype: object
B data     30
key     BBB
dtype: object
C data     45
key     CCC
dtype: object若使用groupby操作,则为:
df.groupby('key').sum()| key | data |
|---|---|
| A | 15 |
| B | 30 |
| C | 45 |
也可以通过numpy格式得出上述结果,则为:df.groupby('key').aggregate(np.sum)。
平均值也类似:
df.groupby('key').aggregate(np.mean)| key | data |
|---|---|
| A | 5 |
| B | 10 |
| C | 15 |
df = pd.read_csv('./data/titanic.csv')
df.groupby('Sex')['Age'].mean()
返回结果为:
Sex
female    27.915709
male      30.726645
Name: Age, dtype: float64
import pandas as pd
import numpy as np
df = pd.DataFrame({'A' : ['foo', 'bar', 'foo', 'bar',
'foo', 'bar', 'foo', 'foo'],
'B' : ['one', 'one', 'two', 'three',
'two', 'two', 'one', 'three'],
'C' : np.random.randn(8),
'D' : np.random.randn(8)})| A | B | C | D | |
|---|---|---|---|---|
| 0 | foo | one | -0.785250 | 1.010458 |
| 1 | bar | one | 2.549941 | 1.704677 |
| 2 | foo | two | -0.255153 | -0.603249 |
| 3 | bar | three | -0.954625 | 0.117662 |
| 4 | foo | two | -0.548512 | 0.648127 |
| 5 | bar | two | -0.642762 | -1.111568 |
| 6 | foo | one | 0.870697 | 0.556371 |
| 7 | foo | three | 0.839937 | 0.798669 |
grouped = df.groupby('A')
grouped.count()| A | B | C | D |
|---|---|---|---|
| bar | 3 | 3 | 3 |
| foo | 5 | 5 | 5 |
grouped = df.groupby(['A','B'])
grouped.count()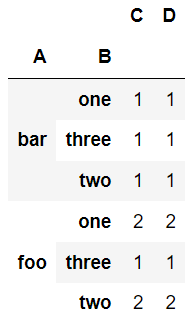
def get_letter_type(letter):
    if letter.lower() in 'aeiou':
        return 'a'
    else:
        return 'b'
grouped = df.groupby(get_letter_type,axis = 1)
grouped.count().iloc[0]
a 1
b 3
Name: 0, dtype: int64df2.groupby(['X']).get_group('A')| X | Y | |
|---|---|---|
| 0 | A | 1 |
| 2 | A | 3 |
grouped = df.groupby(['A','B'])
grouped.aggregate(np.sum)
相同的索引会进行合并显示:
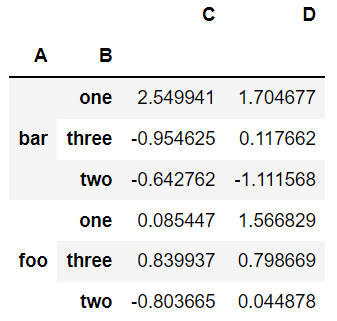
grouped = df.groupby(['A','B'],as_index = False)
grouped.aggregate(np.sum)| A | B | C | D | |
|---|---|---|---|---|
| 0 | bar | one | 2.549941 | 1.704677 |
| 1 | bar | three | -0.954625 | 0.117662 |
| 2 | bar | two | -0.642762 | -1.111568 |
| 3 | foo | one | 0.085447 | 1.566829 |
| 4 | foo | three | 0.839937 | 0.798669 |
| 5 | foo | two | -0.803665 | 0.044878 |
重新构建索引:df.groupby(['A','B']).sum().reset_index(),也能显示以上结果。
得到分组组合个数:
grouped = df.groupby(['A','B'])
grouped.size()
A B
bar one 1
three 1
two 1
foo one 2
three 1
two 2
dtype: int64获取统计特性:
grouped.describe().head()
agg函数用于调用groupby函数之后,对数据做一些聚合操作,包括sum,min,max以及其他一些聚合函数:
grouped = df.groupby('A')
grouped['C'].agg([np.sum,np.mean,np.std])| A | sum | mean | std |
|---|---|---|---|
| bar | 0.952553 | 0.317518 | 1.939613 |
| foo | 0.121719 | 0.024344 | 0.781542 |
还可以通过字典结构指定分组名字:
grouped['C'].agg({'res_sum':np.sum,'res_mean':np.mean,'res_std':np.std})2.4 数值运算
2.4.1 运算
构造DataFrame结构:
import pandas as pd
df = pd.DataFrame([[1,2,3],[4,5,6]],index = ['a','b'],columns = ['A','B','C'])| A | B | C | |
|---|---|---|---|
| a | 1 | 2 | 3 |
| b | 4 | 5 | 6 |
df.sum()默认按列求和,返回结果为:
A    5
B    7
C    9
dtype: int64
可以指定维度:
df.sum(axis = 1) #也可以使用df.sum(axis = 'columns')返回结果为:
a     6
b    15
dtype: int64还有df.mean()、df.min()、df.max()、df.median()(中位数)等。
2.4.2 二元统计
- 统计协方差:
df.cov()
| PassengerId | Survived | Pclass | Age | SibSp | Parch | Fare | |
|---|---|---|---|---|---|---|---|
| PassengerId | 66231.000000 | -0.626966 | -7.561798 | 138.696504 | -16.325843 | -0.342697 | 161.883369 |
| Survived | -0.626966 | 0.236772 | -0.137703 | -0.551296 | -0.018954 | 0.032017 | 6.221787 |
| Pclass | -7.561798 | -0.137703 | 0.699015 | -4.496004 | 0.076599 | 0.012429 | -22.830196 |
| Age | 138.696504 | -0.551296 | -4.496004 | 211.019125 | -4.163334 | -2.344191 | 73.849030 |
| SibSp | -16.325843 | -0.018954 | 0.076599 | -4.163334 | 1.216043 | 0.368739 | 8.748734 |
| Parch | -0.342697 | 0.032017 | 0.012429 | -2.344191 | 0.368739 | 0.649728 | 8.661052 |
| Fare | 161.883369 | 6.221787 | -22.830196 | 73.849030 | 8.748734 | 8.661052 | 2469.436846 |
- 统计相关系数:
df.corr()
| PassengerId | Survived | Pclass | Age | SibSp | Parch | Fare | |
|---|---|---|---|---|---|---|---|
| PassengerId | 1.000000 | -0.005007 | -0.035144 | 0.036847 | -0.057527 | -0.001652 | 0.012658 |
| Survived | -0.005007 | 1.000000 | -0.338481 | -0.077221 | -0.035322 | 0.081629 | 0.257307 |
| Pclass | -0.035144 | -0.338481 | 1.000000 | -0.369226 | 0.083081 | 0.018443 | -0.549500 |
| Age | 0.036847 | -0.077221 | -0.369226 | 1.000000 | -0.308247 | -0.189119 | 0.096067 |
| SibSp | -0.057527 | -0.035322 | 0.083081 | -0.308247 | 1.000000 | 0.414838 | 0.159651 |
| Parch | -0.001652 | 0.081629 | 0.018443 | -0.189119 | 0.414838 | 1.000000 | 0.216225 |
| Fare | 0.012658 | 0.257307 | -0.549500 | 0.096067 | 0.159651 | 0.216225 | 1.000000 |
- **统计不同属性的个数
value_counts**:df['Age'].value_counts()
24.00    30
22.00    27
18.00    26
19.00    25
30.00    25
28.00    25
21.00    24
25.00    23
36.00    22
29.00    20
32.00    18
......可以指定为升序:df['Age'].value_counts(ascending = True)
可以通过bins作分组:df['Age'].value_counts(ascending = True,bins = 5)
(64.084, 80.0]       11
(48.168, 64.084]     69
(0.339, 16.336]     100
(32.252, 48.168]    188
(16.336, 32.252]    346
Name: Age, dtype: int64count()可以用于计数样本:df['Pclass'].count()
2.5 对象操作
2.5.1 Series结构的增删改查
data = [10,11,12]
index = ['a','b','c']
s = pd.Series(data = data,index = index)
返回结果为:
a    10
b    11
c    12
dtype: int64查操作:
s[0]				#10
s[0:2]				#a    10
					#b    11
					#dtype: int64
mask = [True,False,True]
s[mask]
s.loc['b']			#11
s.iloc[1] #11改操作:
s1 = s.copy()
s1['a'] = 100
s1
a 100
b 11
c 12
dtype: int64还可以使用replace函数进行修改(inplace = True将在原始series结构进行改变):
s1.replace(to_replace = 100,value = 101,inplace = True)
a    101
b     11
c     12
dtype: int64
可以修改索引:
s1.index										#Index(['a', 'b', 'c'], dtype='object')
s1.index = ['a','b','d']						#a    101 b     11 d     12 dtype: int64
s1.rename(index = {'a':'A'},inplace = True) #单独修改某一索引,index值指定成字典结构增操作:
data = [100,110]
index = ['h','k']
s2 = pd.Series(data = data,index = index)
s3 = s1.append(s2)								#第一种
s3['j'] = 500									#第二种
s1.append(s2,ignore_index = True)				#ignore_index = True,改变原有索引方式
ignore_index = False:
A    101
b     11
d     12
j    500
h    100
k    110
dtype: int64
ignore_index = True:
0    101
1     11
2     12
3    500
4    100
5    110
dtype: int64删操作:
del s1['A']s1.drop(['b','d'],inplace = True)
2.5.2 DataFrame结构的增删改查
data = [[1,2,3],[4,5,6]]
index = ['a','b']
columns = ['A','B','C']

df = pd.DataFrame(data=data,index=index,columns = columns)查操作是类似的:
df['A']df.iloc[0]df.loc['a']
改操作:
df.loc['a']['A']df.loc['a']['A'] = 150df.index = ['f','g']
增操作:
- 增加行:
df.loc['c'] = [1,2,3]					#增加一行数据
data = [[1,2,3],[4,5,6]]
index = ['j','k']
columns = ['A','B','C']
df2 = pd.DataFrame(data=data,index=index,columns = columns)
df3 = pd.concat([df,df2],axis = 0) #连接操作- 增加列:
df2['Tang'] = [10,11]					#增加新的列
df4 = pd.DataFrame([[10,11],[12,13]],index=['j','k'],columns=['D','E'])
df5 = pd.concat([df2,df4],axis = 1) #增加多列| A | B | C | Tang | D | E | |
|---|---|---|---|---|---|---|
| j | 1 | 2 | 3 | 10 | 10 | 11 |
| k | 4 | 5 | 6 | 11 | 12 | 13 |
删操作:
df5.drop(['j'],axis=0,inplace = True) #删除一行数据| A | B | C | Tang | D | E | |
|---|---|---|---|---|---|---|
| k | 4 | 5 | 6 | 11 | 12 | 13 |
del df5['Tang']										#删除一列数据
df5.drop(['A','B','C'],axis = 1,inplace = True)		#删除多列数据
2.5.3 merge操作
left = pd.DataFrame({'key':['K0','K1','K2','K3'],'A':['A0','A1','A2','A3'],'B':['B0','B1','B2','B3']})
right = pd.DataFrame({'key':['K0','K1','K2','K3'],'C':['C0','C1','C2','C3'],'D':['D0','D1','D2','D3']})
pd.merge(left,right,on = 'key') #不加on默认以相同元素为键| key | A | B | C | D | |
|---|---|---|---|---|---|
| 0 | K0 | A0 | B0 | C0 | D0 |
| 1 | K1 | A1 | B1 | C1 | D1 |
| 2 | K2 | A2 | B2 | C2 | D2 |
| 3 | K3 | A3 | B3 | C3 | D3 |
若有两个键key1、key2,执行pd.merge(left,right,on = 'key1'),则结果为:
| key1 | key2_x | A | B | key2_y | C | D | |
|---|---|---|---|---|---|---|---|
| 0 | K0 | K0 | A0 | B0 | K0 | C0 | D0 |
| 1 | K1 | K1 | A1 | B1 | K1 | C1 | D1 |
| 2 | K2 | K2 | A2 | B2 | K2 | C2 | D2 |
| 3 | K3 | K3 | A3 | B3 | K3 | C3 | D3 |
若执行res = pd.merge(left, right, on = ['key1','key2']),则结果为:
| key1 | key2 | A | B | C | D | |
|---|---|---|---|---|---|---|
| 0 | K0 | K0 | A0 | B0 | C0 | D0 |
| 1 | K1 | K1 | A1 | B1 | C1 | D1 |
| 2 | K2 | K2 | A2 | B2 | C2 | D2 |
| 3 | K3 | K3 | A3 | B3 | C3 | D3 |
若两个键有部分不一致,即:
left = pd.DataFrame({'key1': ['K0', 'K1', 'K2', 'K3'],
                     'key2': ['K0', 'K1', 'K2', 'K3'],
                    'A': ['A0', 'A1', 'A2', 'A3'],
                    'B': ['B0', 'B1', 'B2', 'B3']})
right = pd.DataFrame({'key1': ['K0', 'K1', 'K2', 'K3'],
                      'key2': ['K0', 'K1', 'K2', 'K4'],
                    'C': ['C0', 'C1', 'C2', 'C3'],
                    'D': ['D0', 'D1', 'D2', 'D3']})

print (left)
print (right)仍执行res = pd.merge(left, right, on = ['key1','key2']),则结果为:
| key1 | key2 | A | B | C | D | |
|---|---|---|---|---|---|---|
| 0 | K0 | K0 | A0 | B0 | C0 | D0 |
| 1 | K1 | K1 | A1 | B1 | C1 | D1 |
| 2 | K2 | K2 | A2 | B2 | C2 | D2 |
若指定how = outer,即取并集:res = pd.merge(left, right, on = ['key1', 'key2'], how = 'outer'),则结果为:
| A | B | key1 | key2 | C | D | |
|---|---|---|---|---|---|---|
| 0 | A0 | B0 | K0 | K0 | C0 | D0 |
| 1 | A1 | B1 | K1 | K1 | C1 | D1 |
| 2 | A2 | B2 | K2 | K2 | C2 | D2 |
| 3 | A3 | B3 | K3 | K3 | NaN | NaN |
| 4 | NaN | NaN | K3 | K4 | C3 | D3 |
加入指示器indicator,res = pd.merge(left, right, on = ['key1', 'key2'], how = 'outer', indicator = True),则结果为:
| A | B | key1 | key2 | C | D | _merge | |
|---|---|---|---|---|---|---|---|
| 0 | A0 | B0 | K0 | K0 | C0 | D0 | both |
| 1 | A1 | B1 | K1 | K1 | C1 | D1 | both |
| 2 | A2 | B2 | K2 | K2 | C2 | D2 | both |
| 3 | A3 | B3 | K3 | K3 | NaN | NaN | left_only |
| 4 | NaN | NaN | K3 | K4 | C3 | D3 | right_only |
指定以左表/右表为基准:如res = pd.merge(left, right, how = 'left'),则结果为:
| A | B | key1 | key2 | C | D | |
|---|---|---|---|---|---|---|
| 0 | A0 | B0 | K0 | K0 | C0 | D0 |
| 1 | A1 | B1 | K1 | K1 | C1 | D1 |
| 2 | A2 | B2 | K2 | K2 | C2 | D2 |
| 3 | A3 | B3 | K3 | K3 | NaN | NaN |
2.6 显示设置
- 显示当前显示数据最大行数:
pd.get_option('display.max_rows') - 设置当前显示数据最大行数:
pd.set_option('display.max_rows',6)
同理,列操作分别为:pd.get_option('display.max_columns'),pd.set_option('display.max_columns',30)。
- 设置字符串长度:
pd.get_option('display.max_colwidth'),pd.set_option('display.max_colwidth',100) - 设置字符串小数点精度:
pd.get_option('display.precision'),pd.set_option('display.precision',5)
2.7 数据透视表
import pandas as pd
example = pd.DataFrame({'Month': ["January", "January", "January", "January",
                                  "February", "February", "February", "February",
                                  "March", "March", "March", "March"],
                   'Category': ["Transportation", "Grocery", "Household", "Entertainment",
                                "Transportation", "Grocery", "Household", "Entertainment",
                                "Transportation", "Grocery", "Household", "Entertainment"],
'Amount': [74., 235., 175., 100., 115., 240., 225., 125., 90., 260., 200., 120.]})| Month | Category | Amount | |
|---|---|---|---|
| 0 | January | Transportation | 74.0 |
| 1 | January | Grocery | 235.0 |
| 2 | January | Household | 175.0 |
| 3 | January | Entertainment | 100.0 |
| 4 | February | Transportation | 115.0 |
| 5 | February | Grocery | 240.0 |
| 6 | February | Household | 225.0 |
| 7 | February | Entertainment | 125.0 |
| 8 | March | Transportation | 90.0 |
| 9 | March | Grocery | 260.0 |
| 10 | March | Household | 200.0 |
| 11 | March | Entertainment | 120.0 |
example_pivot = example.pivot(index = 'Category',columns= 'Month',values = 'Amount') #values代表统计属性| Month | February | January | March |
|---|---|---|---|
| Category | |||
| Entertainment | 125.0 | 100.0 | 120.0 |
| Grocery | 240.0 | 235.0 | 260.0 |
| Household | 225.0 | 175.0 | 200.0 |
| Transportation | 115.0 | 74.0 | 90.0 |
example_pivot.sum(axis = 1)Category
Entertainment 345.0
Grocery 735.0
Household 600.0
Transportation 279.0
dtype: float64example_pivot.sum(axis = 0)Month
February 705.0
January 584.0
March 670.0
dtype: float64案例:
df = pd.read_csv('./data/titanic.csv')
df.head()| PassengerId | Survived | Pclass | Name | Sex | Age | SibSp | Parch | Ticket | Fare | Cabin | Embarked | |
|---|---|---|---|---|---|---|---|---|---|---|---|---|
| 0 | 1 | 0 | 3 | Braund, Mr. Owen Harris | male | 22.0 | 1 | 0 | A/5 21171 | 7.2500 | NaN | S |
| 1 | 2 | 1 | 1 | Cumings, Mrs. John Bradley (Florence Briggs Th… | female | 38.0 | 1 | 0 | PC 17599 | 71.2833 | C85 | C |
| 2 | 3 | 1 | 3 | Heikkinen, Miss. Laina | female | 26.0 | 0 | 0 | STON/O2. 3101282 | 7.9250 | NaN | S |
| 3 | 4 | 1 | 1 | Futrelle, Mrs. Jacques Heath (Lily May Peel) | female | 35.0 | 1 | 0 | 113803 | 53.1000 | C123 | S |
| 4 | 5 | 0 | 3 | Allen, Mr. William Henry | male | 35.0 | 0 | 0 | 373450 | 8.0500 | NaN | S |
#默认值就是求平均
df.pivot_table(index = 'Sex',columns='Pclass',values='Fare')| Pclass | 1 | 2 | 3 |
|---|---|---|---|
| Sex | |||
| female | 106.125798 | 21.970121 | 16.118810 |
| male | 67.226127 | 19.741782 | 12.661633 |
#指定为求最大值
df.pivot_table(index = 'Sex',columns='Pclass',values='Fare',aggfunc='max')
#指定求平均
df.pivot_table(index = 'Pclass',columns='Sex',values='Survived',aggfunc='mean')| Pclass | 1 | 2 | 3 |
|---|---|---|---|
| Sex | |||
| female | 512.3292 | 65.0 | 69.55 |
| male | 512.3292 | 73.5 | 69.55 |
类似地,还有计数:df.pivot_table(index = 'Sex',columns='Pclass',values='Fare',aggfunc='count')。
pandas中也有类似计数:pd.crosstab(index = df['Sex'],columns = df['Pclass'])
三、时间操作
3.1 时间基本操作
import pandas as pd
ts = pd.Timestamp('2022-08-17')				#Timestamp('2022-08-17 00:00:00')
ts.month									#8
ts.day										#17
ts + pd.Timedelta('5 days') #Timestamp('2022-08-22 00:00:00')此外,还有pd.to_datetime('2022-08-17')/pd.to_datetime('17/8/2022')来构造时间。
一般我们可以用于构造series结构:
s = pd.Series(['2022-08-17 00:00:00','2022-08-22 00:00:00','2022-08-23 00:00:00'])0 2022-08-17 00:00:00
1 2022-08-22 00:00:00
2 2022-08-23 00:00:00
dtype: object把它转换为datetime类型:
ts = pd.to_datetime(s)0 2022-08-17
1 2022-08-22
2 2022-08-23
dtype: datetime64[ns]现在我们可以调用它的属性:
ts.dt.hour0 0
1 0
2 0
dtype: int64ts.dt.weekday #星期索引,周一的索引为0,依此类推0 2
1 0
2 1
dtype: int64构造series结构,可以直接指定datetime类型:
pd.Series(pd.date_range(start='2022-08-24',periods = 10,freq = '12H')) #freq为时间间隔0 2022-08-24 00:00:00
1 2022-08-24 12:00:00
2 2022-08-25 00:00:00
3 2022-08-25 12:00:00
4 2022-08-26 00:00:00
5 2022-08-26 12:00:00
6 2022-08-27 00:00:00
7 2022-08-27 12:00:00
8 2022-08-28 00:00:00
9 2022-08-28 12:00:00
dtype: datetime64[ns]指定index列并解析date数据:
data = pd.read_csv('./data/flowdata.csv',index_col = 0,parse_dates = True)
data.head()
3.2 时间序列操作
进行取数据操作:【指定索引】
data[pd.Timestamp('2012-01-01 09:00'):pd.Timestamp('2012-01-01 19:00')]
data[('2012-01-01 09:00'):('2012-01-01 19:00')]| Time | L06_347 | LS06_347 | LS06_348 |
|---|---|---|---|
| 2012-01-01 09:00:00 | 0.330750 | 0.293583 | 0.029750 |
| 2012-01-01 12:00:00 | 0.295000 | 0.285167 | 0.031750 |
| 2012-01-01 15:00:00 | 0.301417 | 0.287750 | 0.031417 |
| 2012-01-01 18:00:00 | 0.322083 | 0.304167 | 0.038083 |
data['2013']											#根据年份取
data['2012-01':'2012-03']								#根据年份+月份取
data[data.index.month == 1]								#根据布尔类型索引取出月份
data[(data.index.hour > 8) & (data.index.hour <12)]		#取出时间片段法1
data.between_time('08:00','12:00') #取出时间片段法2,包含端点对时间序列进行重采样:data.resample('D').mean().head()/data.resample('D').max().head()
| Time | L06_347 | LS06_347 | LS06_348 | month |
|---|---|---|---|---|
| 2009-01-01 | 0.125010 | 0.092281 | 0.016635 | 1 |
| 2009-01-02 | 0.124146 | 0.095781 | 0.016406 | 1 |
| 2009-01-03 | 0.113562 | 0.085542 | 0.016094 | 1 |
| 2009-01-04 | 0.140198 | 0.102708 | 0.017323 | 1 |
| 2009-01-05 | 0.128812 | 0.104490 | 0.018167 | 1 |
取时间节点为多天(如3天):
data.resample('3D').mean().head()
data.resample('M').mean().head()						#以月份为单位
画图展示:
%matplotlib notebook									#进行画图展示
data.resample('M').mean().plot()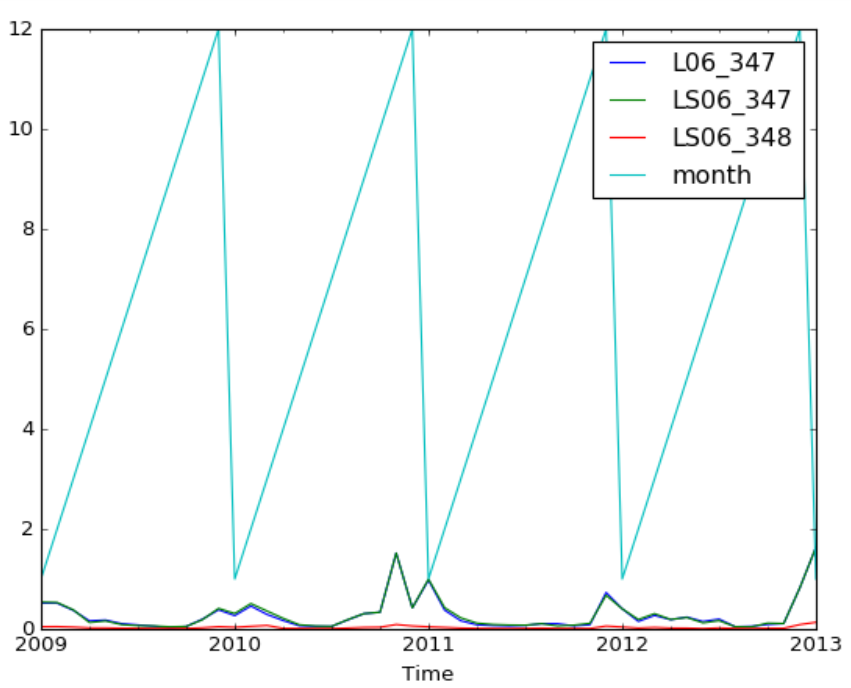
四、Pandas常用操作
data = pd.DataFrame({'group':['a','a','a','b','b','b','c','c','c'],'data':[4,3,2,1,12,3,4,5,7]})| group | data | |
|---|---|---|
| 0 | a | 4 |
| 1 | a | 3 |
| 2 | a | 2 |
| 3 | b | 1 |
| 4 | b | 12 |
| 5 | b | 3 |
| 6 | c | 4 |
| 7 | c | 5 |
| 8 | c | 7 |
4.1 排序
data.sort_values(by=['group','data'],ascending = [False,True],inplace = True)| group | data | |
|---|---|---|
| 6 | c | 4 |
| 7 | c | 5 |
| 8 | c | 7 |
| 3 | b | 1 |
| 5 | b | 3 |
| 4 | b | 12 |
| 2 | a | 2 |
| 1 | a | 3 |
| 0 | a | 4 |
data = pd.DataFrame({'k1':['one']*3+['two']*4,'k2':[3,2,1,3,3,4,4]})
data.sort_values(by='k2')| k1 | k2 | |
|---|---|---|
| 2 | one | 1 |
| 1 | one | 2 |
| 0 | one | 3 |
| 3 | two | 3 |
| 4 | two | 3 |
| 5 | two | 4 |
| 6 | two | 4 |
data.drop_duplicates() #去除重复数据| k1 | k2 | |
|---|---|---|
| 0 | one | 3 |
| 1 | one | 2 |
| 2 | one | 1 |
| 3 | two | 3 |
| 5 | two | 4 |
data.drop_duplicates(subset = 'k1') #指定列去重| k1 | k2 | |
|---|---|---|
| 0 | one | 3 |
| 3 | two | 3 |
4.2 同类项合并(作映射)
data = pd.DataFrame({'food':['A1','A2','B1','B2','B3','C1','C2'],'data':[1,2,3,4,5,6,7]})def food_map(series):
if series['food'] == 'A1':
return 'A'
elif series['food'] == 'A2':
return 'A'
elif series['food'] == 'B1':
return 'B'
elif series['food'] == 'B2':
return 'B'
elif series['food'] == 'B3':
return 'B'
elif series['food'] == 'C1':
return 'C'
elif series['food'] == 'C2':
return 'C'
data['food_map'] = data.apply(food_map,axis = 'columns') #对数据执行相同的操作(函数)| data | food | food_map | |
|---|---|---|---|
| 0 | 1 | A1 | A |
| 1 | 2 | A2 | A |
| 2 | 3 | B1 | B |
| 3 | 4 | B2 | B |
| 4 | 5 | B3 | B |
| 5 | 6 | C1 | C |
| 6 | 7 | C2 | C |
或使用map操作:
food2Upper = {
    'A1':'A',
    'A2':'A',
    'B1':'B',
    'B2':'B',
    'B3':'B',
    'C1':'C',
    'C2':'C'
}
data['upper'] = data['food'].map(food2Upper)| data | food | food_map | upper | |
|---|---|---|---|---|
| 0 | 1 | A1 | A | A |
| 1 | 2 | A2 | A | A |
| 2 | 3 | B1 | B | B |
| 3 | 4 | B2 | B | B |
| 4 | 5 | B3 | B | B |
| 5 | 6 | C1 | C | C |
| 6 | 7 | C2 | C | C |
4.3 assign、replace方法
import numpy as np
df = pd.DataFrame({'data1':np.random.randn(5),
                  'data2':np.random.randn(5)})
df2 = df.assign(ration = df['data1']/df['data2'])| data1 | data2 | ration | |
|---|---|---|---|
| 0 | -1.069925 | -0.186540 | 5.735617 |
| 1 | 0.636127 | 0.020425 | 31.143814 |
| 2 | 0.366197 | -0.102836 | -3.560992 |
| 3 | -0.975327 | 0.451201 | -2.161624 |
| 4 | -1.562407 | -2.436845 | 0.641160 |
使用drop方法可以删去ration列:df2.drop('ration',axis='columns',inplace=True)
data = pd.Series([1,2,3,4,5,6,7,8,9])
data.replace(9,np.nan,inplace=True)
0 1.0
1 2.0
2 3.0
3 4.0
4 5.0
5 6.0
6 7.0
7 8.0
8 NaN
dtype: float644.4 连续值离散化:cut方法
ages = [15,18,20,21,22,34,41,52,63,79]
bins = [10,40,80]
bins_res = pd.cut(ages,bins)
[(10, 40], (10, 40], (10, 40], (10, 40], (10, 40], (10, 40], (40, 80], (40, 80], (40, 80], (40, 80]]
Categories (2, interval[int64]): [(10, 40] < (40, 80]]bins_res.labels #array([0, 0, 0, 0, 0, 0, 1, 1, 1, 1], dtype=int8)
pd.value_counts(bins_res) #(10, 40] 6 (40, 80] 4 dtype: int64pd.cut(ages,[10,30,50,80])[(10, 30], (10, 30], (10, 30], (10, 30], (10, 30], (30, 50], (30, 50], (50, 80], (50, 80], (50, 80]]
Categories (3, interval[int64]): [(10, 30] < (30, 50] < (50, 80]]group_names = ['Yonth','Mille','Old']
#pd.cut(ages,[10,20,50,80],labels=group_names)
pd.value_counts(pd.cut(ages,[10,20,50,80],labels=group_names)) #labels即bins换完之后的名字Mille 4
Old 3
Yonth 3
dtype: int644.5 缺失值的情况
df = pd.DataFrame([range(3),[0, np.nan,0],[0,0,np.nan],range(3)])| 0 | 1 | 2 | |
|---|---|---|---|
| 0 | 0 | 1.0 | 2.0 |
| 1 | 0 | NaN | 0.0 |
| 2 | 0 | 0.0 | NaN |
| 3 | 0 | 1.0 | 2.0 |
df.isnull() #查看是否有缺失值| 0 | 1 | 2 | |
|---|---|---|---|
| 0 | False | False | False |
| 1 | False | True | False |
| 2 | False | False | True |
| 3 | False | False | False |
df.isnull().any() #哪一列是否有缺失值0 False
1 True
2 True
dtype: booldf.isnull().any(axis = 1) #哪一行是否有缺失值0 False
1 True
2 True
3 False
dtype: booldf.fillna(5) #填充缺失值0 1 2
0 0 1.0 2.0
1 0 5.0 0.0
2 0 0.0 5.0
3 0 1.0 2.0df[df.isnull().any(axis = 1)] #通过布尔类型的索引找到带缺失值的行| 0 | 1 | 2 | |
|---|---|---|---|
| 1 | 0 | NaN | 0.0 |
| 2 | 0 | 0.0 | NaN |
4.6 字符串操作
import numpy as np
import pandas as pd
s = pd.Series(['A','b','B','gaer','GAER',np.nan])
0 A
1 b
2 B
3 gaer
4 GAER
5 NaN
dtype: objects.str.lower() #将字符串中的字母全部转为小写0 a
1 b
2 b
3 gaer
4 gaer
5 NaN
dtype: object同理,将字符串中的字母全部转为大写可使用:s.str.upper()。
统计字符串长度:s.str.len()
去除字符串中的空格:strip方法
index = pd.Index(['  tang','yu   ','abc'])
index.str.strip()
注:
还可以只去掉左/右空格:
index.str.lstrip(),index.str.rstrip()
df = pd.DataFrame(np.random.randn(3,2),columns = ['A a','B b'],index = range(3))
df.columns = df.columns.str.replace(' ','_')| A_a | B_b | |
|---|---|---|
| 0 | -1.392628 | 1.020082 |
| 1 | 0.866707 | 0.654731 |
| 2 | -0.320871 | 1.360513 |
s = pd.Series(['a_b_C','c_d_e','f_g_h'])
s.str.split('_')
0 [a, b, C]
1 [c, d, e]
2 [f, g, h]
dtype: object得到新的字段:
s.str.split('_',expand = True)| 0 | 1 | 2 | |
|---|---|---|---|
| 0 | a | b | C |
| 1 | c | d | e |
| 2 | f | g | h |
s.str.split('_',expand = True,n=1)| 0 | 1 | |
|---|---|---|
| 0 | a | b_C |
| 1 | c | d_e |
| 2 | f | g_h |
进行包含的判断:
s = pd.Series(['A','Aas','Afgew','Ager','Agre','Ager'])0 A
1 Aas
2 Afgew
3 Ager
4 Agre
5 Ager
dtype: objects.str.contains('Ag')0 False
1 False
2 False
3 True
4 True
5 True
dtype: bool指定分隔符:
s = pd.Series(['a','a|b','a|c'])
s.str.get_dummies(sep = '|')| a | b | c | |
|---|---|---|---|
| 0 | 1 | 0 | 0 |
| 1 | 1 | 1 | 0 |
| 2 | 1 | 0 | 1 |
4.7 Pandas绘图
4.7.1 画折线图
%matplotlib inline
import pandas as pd
import numpy as np
s = pd.Series(np.random.randn(10),index = np.arange(0,100,10))	 #生成标准正态分布的伪随机数(均值为0,方差为1)
s.plot()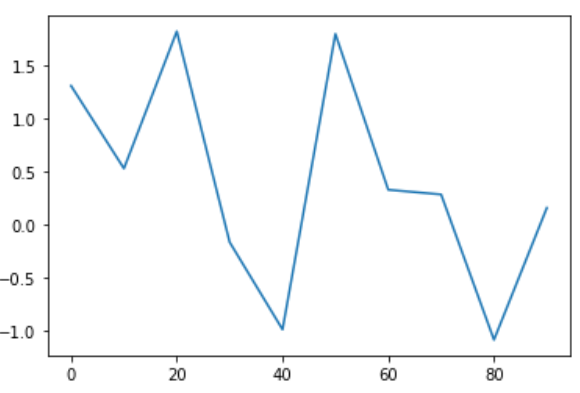
df = pd.DataFrame(np.random.randn(10, 4).cumsum(0),
               index = np.arange(0, 100, 10),
               columns = ['A', 'B', 'C', 'D'])
df.head()
Out[3]:
| A | B | C | D | |
|---|---|---|---|---|
| 0 | -0.887275 | 0.191912 | 0.276001 | -0.804419 |
| 10 | -0.404738 | -1.942269 | 0.183497 | -1.845532 |
| 20 | -0.746758 | -1.534280 | 0.178036 | -0.790430 |
| 30 | -0.702495 | -2.510148 | 1.879569 | -0.421204 |
| 40 | -0.023128 | -1.389147 | 2.205663 | -0.253191 |
df.plot()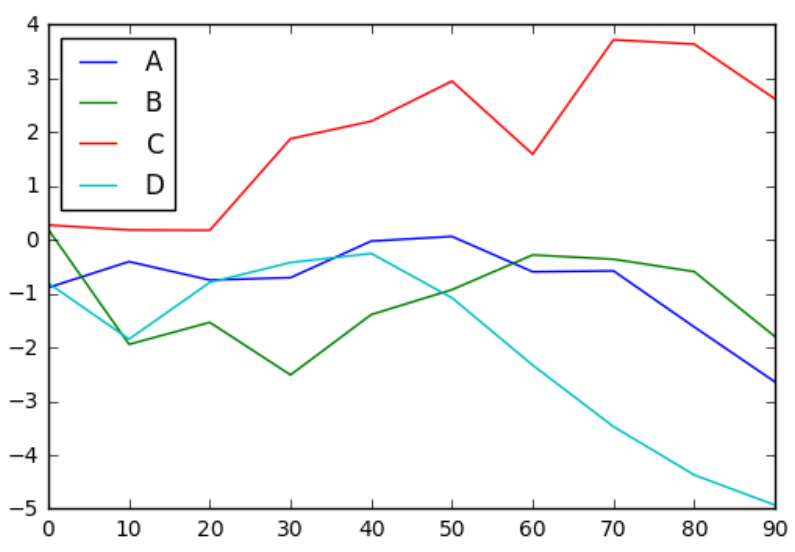
4.7.2 画柱状图
import matplotlib.pyplot as plt

fig,axes = plt.subplots(2,1)
data = pd.Series(np.random.rand(16),index=list('abcdefghijklmnop'))
data.plot(ax = axes[0],kind='bar')			#bar表示竖着画
data.plot(ax = axes[1],kind='barh')			#barh表示横着画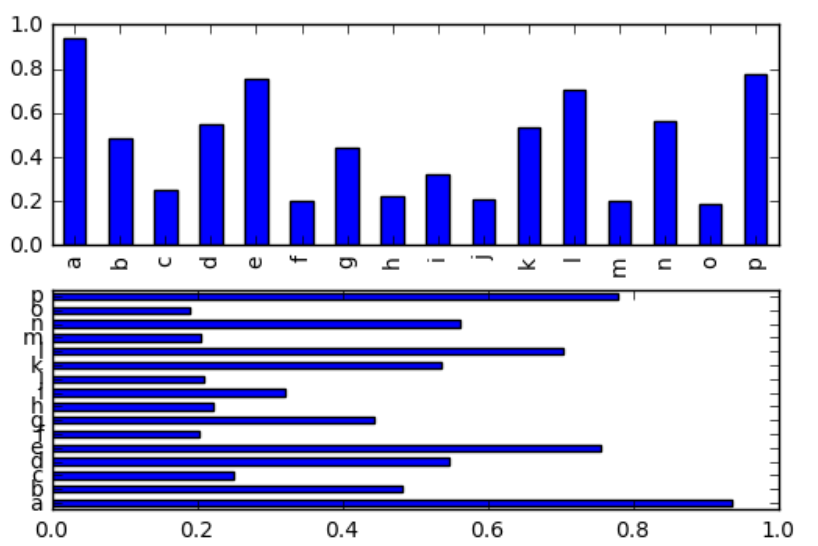
df = pd.DataFrame(np.random.rand(6, 4),
               index = ['one', 'two', 'three', 'four', 'five', 'six'],
               columns = pd.Index(['A', 'B', 'C', 'D'], name = 'Genus'))
df.head()| Genus | A | B | C | D |
|---|---|---|---|---|
| one | 0.130214 | 0.536757 | 0.243533 | 0.371248 |
| two | 0.424017 | 0.052330 | 0.932248 | 0.482683 |
| three | 0.084314 | 0.589451 | 0.876603 | 0.604232 |
| four | 0.561504 | 0.121044 | 0.303261 | 0.065200 |
| five | 0.680850 | 0.177105 | 0.314080 | 0.153842 |
df.plot(kind='bar')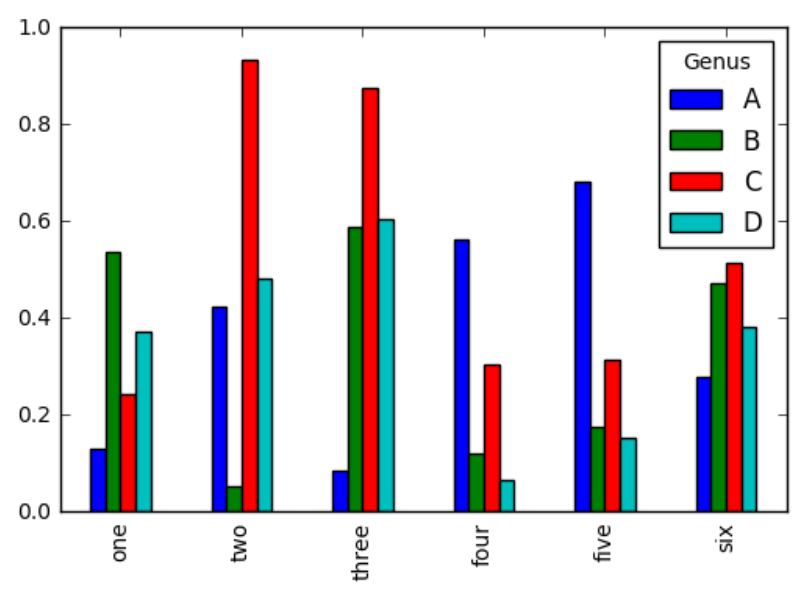
4.7.3 直方图
tips = pd.read_csv('tips.csv')
tips.head()| total_bill | tip | sex | smoker | day | time | size | |
|---|---|---|---|---|---|---|---|
| 0 | 16.99 | 1.01 | Female | No | Sun | Dinner | 2 |
| 1 | 10.34 | 1.66 | Male | No | Sun | Dinner | 3 |
| 2 | 21.01 | 3.50 | Male | No | Sun | Dinner | 3 |
| 3 | 23.68 | 3.31 | Male | No | Sun | Dinner | 2 |
| 4 | 24.59 | 3.61 | Female | No | Sun | Dinner | 4 |
tips.total_bill.plot(kind='hist',bins=50)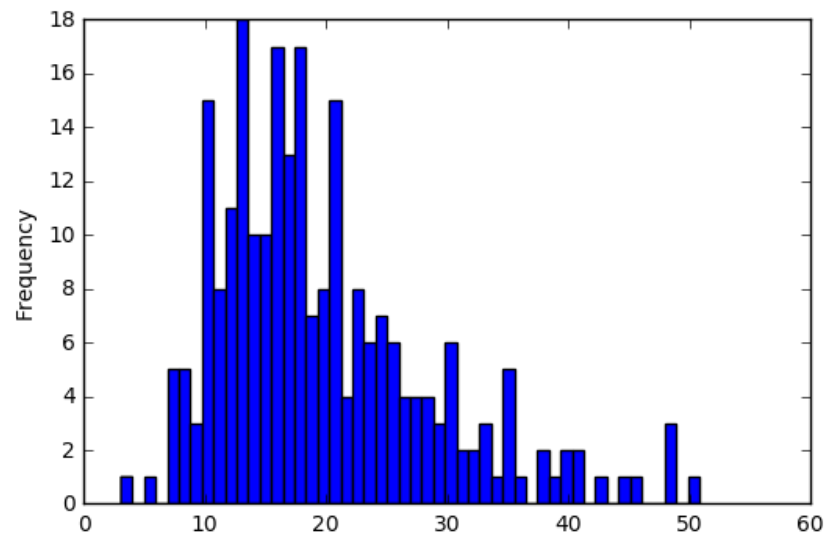
4.7.4 散点图
macro = pd.read_csv('macrodata.csv')
macro.head()
data = macro[['quarter','realgdp','realcons']]
data.plot.scatter('quarter','realgdp')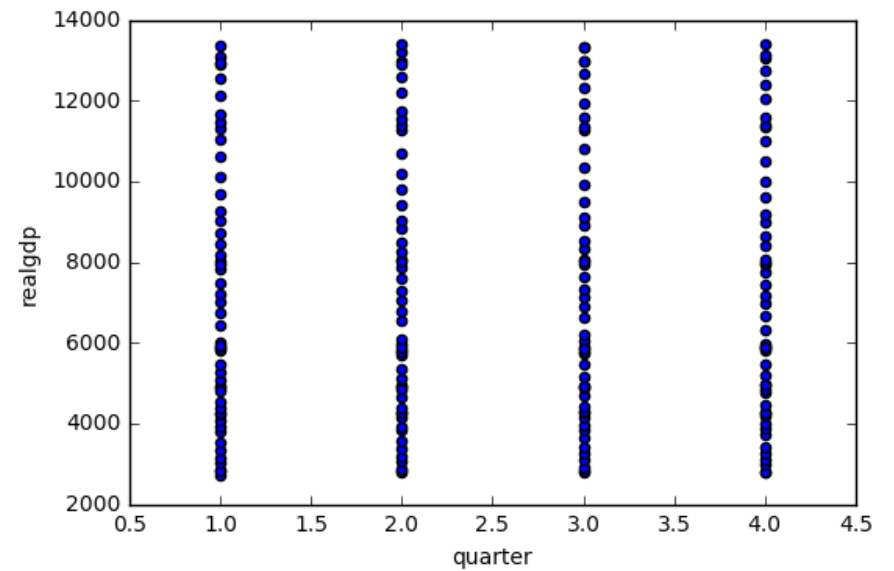
pd.scatter_matrix(data,color='g',alpha=0.3)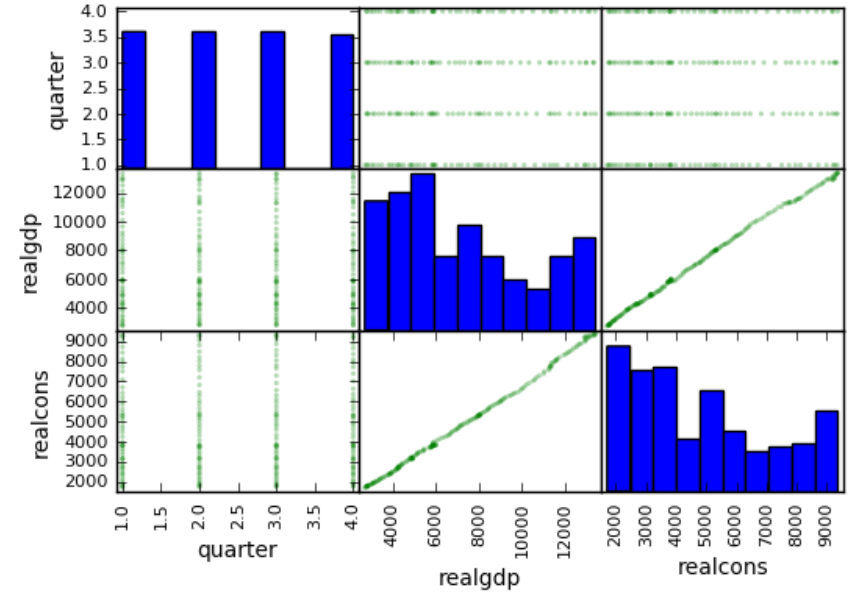
五、Pandas大数据处理技巧
5.1 获取平均内存使用大小
g1 = pd.read_csv('game_logs.csv')
g1.shape								#(171907, 161),数据+列
g1.info(memory_usage='deep')
<class 'pandas.core.frame.DataFrame'>
RangeIndex: 171907 entries, 0 to 171906
Columns: 161 entries, date to acquisition_info
dtypes: float64(77), int64(6), object(78)
memory usage: 859.4 MBfor dtype in ['float64','int64','object']:
selected_dtype = g1.select_dtypes(include = [dtype])
mean_usage_b = selected_dtype.memory_usage(deep = True).mean()
mean_usage_mb = mean_usage_b / 1024 ** 2
print('平均内存占用',dtype,mean_usage_mb,'MB')平均内存占用 float64 1.294733194204477 MB
平均内存占用 int64 1.1242000034877233 MB
平均内存占用 object 9.500870656363572 MB查看各种类型能表达的最大数:
import numpy as np
int_types = ['uint8','int8','int16','int32','int64']		#uint8为无符号整数
for it in int_types:
    print(np.iinfo(it))
Machine parameters for uint8
---------------------------------------------------------------
min = 0
max = 255
---------------------------------------------------------------
Machine parameters for int8
---------------------------------------------------------------
min = -128
max = 127
---------------------------------------------------------------
Machine parameters for int16
---------------------------------------------------------------
min = -32768
max = 32767
---------------------------------------------------------------
Machine parameters for int32
---------------------------------------------------------------
min = -2147483648
max = 2147483647
---------------------------------------------------------------
Machine parameters for int64
---------------------------------------------------------------
min = -9223372036854775808
max = 9223372036854775807
---------------------------------------------------------------5.2 更改数据类型
向下转换数据类型:
def mem_usage(pandas_obj):
    if isinstance(pandas_obj,pd.DataFrame):
        usage_b = pandas_obj.memory_usage(deep = True).sum()
    else:
        usage_b = pandas_obj.memory_usage(deep = True)
    usage_mb = usage_b/1024 ** 2
    return '{:03.2f} MB'.format(usage_mb)
g1_int = g1.select_dtypes(include = ['int64'])
coverted_int = g1_int.apply(pd.to_numeric,downcast = 'unsigned')
print(mem_usage(g1_int))					#7.87 MB
print(mem_usage(coverted_int)) #1.48 MB还可以将float64类型的数据转换为float类型。
gl_obj = gl.select_dtypes(include = ['object']).copy()
gl_obj.describe()
可观察day_of_week列的unique值非常少,故将object类型转为category类型,即可将重复的数据映射到同一个内存空间:
dow = g1_obj.day_of_week
dow.head()
0 Thu
1 Fri
2 Sat
3 Mon
4 Tue
Name: day_of_week, dtype: objectdow_cat = dow.astype('category')
dow_cat.head()0 Thu
1 Fri
2 Sat
3 Mon
4 Tue
Name: day_of_week, dtype: category
Categories (7, object): ['Fri', 'Mon', 'Sat', 'Sun', 'Thu', 'Tue', 'Wed']dow_cat.head(10).cat.codes #查看编码0 4
1 0
2 2
3 1
4 5
5 4
6 2
7 2
8 1
9 5
dtype: int8print(mem_usage(dow)) #9.84 MB
print(mem_usage(dow_cat)) #0.16 MB可根据以下程序进行判断重复数据是否较多:
converted_obj = pd.DataFrame()

for col in gl_obj.columns:
    num_unique_values = len(gl_obj[col].unique())
    num_total_values = len(gl_obj[col])
    if num_unique_values / num_total_values < 0.5:
        converted_obj.loc[:,col] = gl_obj[col].astype('category')
    else:
converted_obj.loc[:,col] = gl_obj[col]print(mem_usage(gl_obj)) #751.64 MB
print(mem_usage(converted_obj)) #51.67 MB5.3 对时间类型的优化
date = optimized_gl.date
date[:5]
0 18710504
1 18710505
2 18710506
3 18710508
4 18710509
Name: date, dtype: uint32print (mem_usage(date)) #0.66 MB指定为标准时间格式,占用内存将变多:
optimized_gl['date'] = pd.to_datetime(date,format='%Y%m%d')
print (mem_usage(optimized_gl['date']))			#1.31 MB
optimized_gl['date'][:5]
0 1871-05-04
1 1871-05-05
2 1871-05-06
3 1871-05-08
4 1871-05-09
Name: date, dtype: datetime64[ns]
